

One of Platinum System’s most powerful tools isn’t used as often as it should be because doctors aren’t aware of how beneficial it can be for the growth of their practice. We’d like to change that. So, if you’re a chiropractor or office manager using Platinum’s EHR software, here’s what you need to know to take advantage of the Reports and Statistics tool:
There’s so much clinic information right at your fingertips, including:
Our Advanced Data Query system can track how many new patients came in during any time period, how many didn’t show, and the overall growth—or decline—of a practice both short and long term.
In the software, go to “List reports,” then “Practice Diagnosis and Recalls Manager,” then “Practice Graphs.” (This can also be accessed at LS9). You will see options to run graphs based on total visits, new patient visits, collections, etc.
In order to track the trends and the overall growth of your practice, choose any category and you’ll be shown 4 types of graphs. On the right of the legend, you can choose which types of graphs to view:
Sample Graph
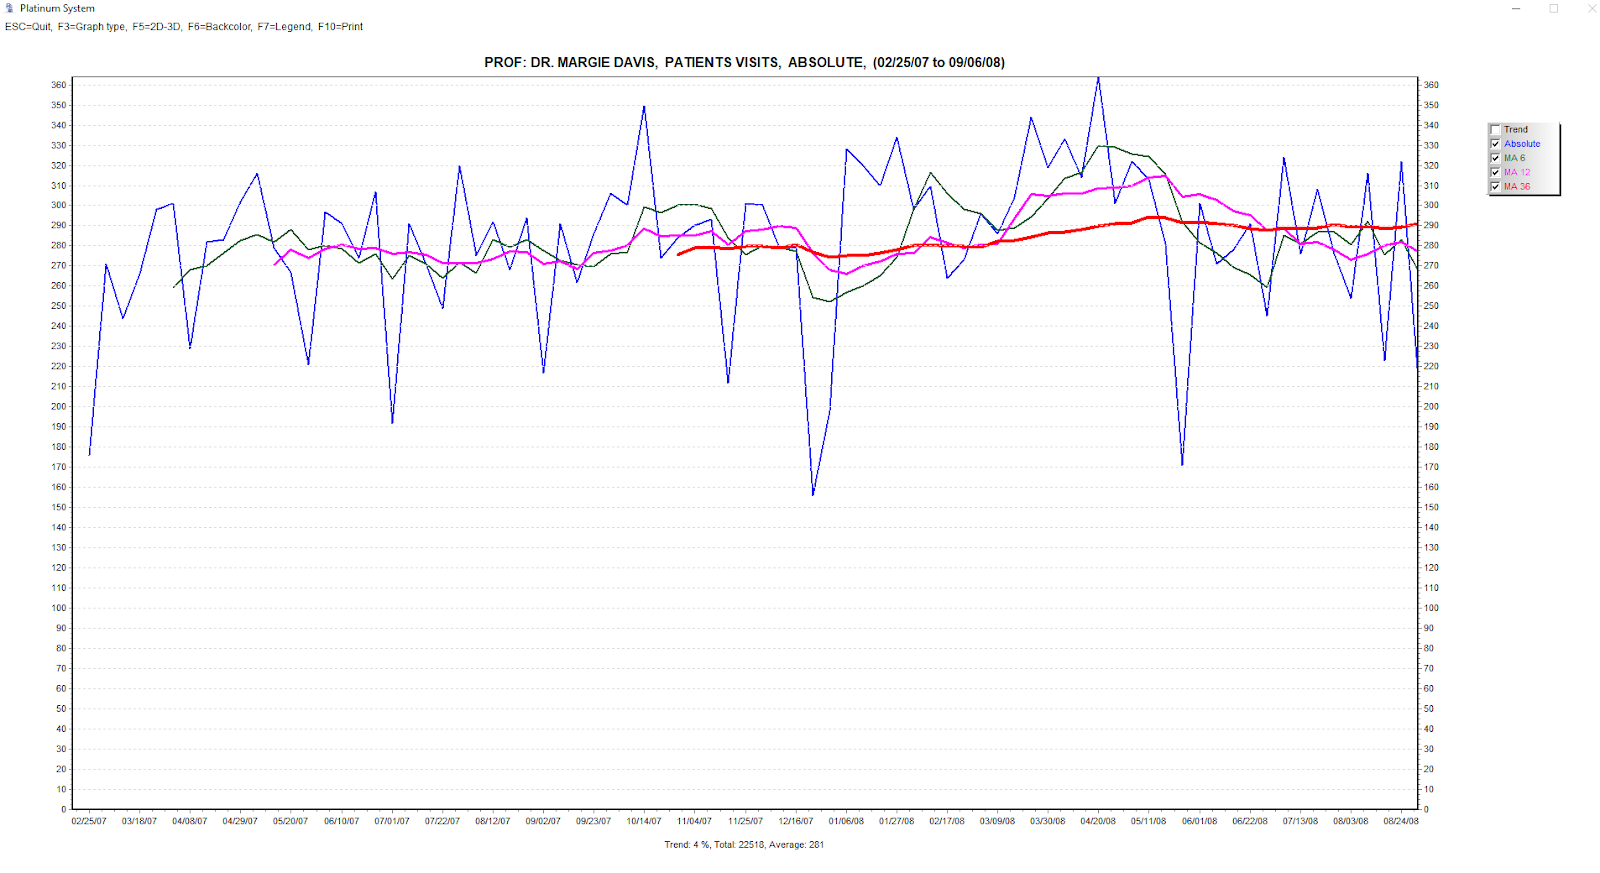
Let’s look at an example. This doctor wanted to see how many patient visits her practice had when she was starting out. She selected “patient visits” and “absolute” from 2/25/07 to 9/06/08.
The dark green line is MA6, which shows the trend of moving averages over a short period of time. The pink line is MA12, which shows a bigger picture of how the practice is doing. The red line, MA36, gives a more long-term picture of her practice’s growth. In this case, the MA36 line begins after the 36th week that her practice was open since the moving average is based on the the previous 36 weeks.
What’s especially useful is to watch how often and how severely the lines cross. When a practice is in growth mode, the MA6 dark green line should remain above the pink MA12 line, which in turn should be above the red MA36 line.
The MA6 lines might take some dips but as long as MA6 doesn’t cross the MA12 line there’s still growth. If the MA6 line crosses the MA12, it’s an indication that something’s going on in her practice that’s causing a decrease in patient visits, which will in turn bring down the MA12 line if the decline in visits is not corrected.
If the MA6 and MA12 lines cross below the MA36, that’s an indication that something serious is going on that could result in longer term decline of the practice’s growth. In this case, the MA6 and MA12 lines are above the MA36 lines more than they’re below it, so the overall trend of the entire graph shows a 4% growth in patient visits.
Doctors can also create graphs to track overall trends and statistics for growth measures like how many new patients came within a certain time period. They can compare this to another graph that shows how many patients are leaving without making a new appointment, or how many are scheduled but don’t come in for the appointment, or how many walk-in’s came without an appointment.
By viewing whether the percentages of these growth measurements are going up or down, doctors can see where they need improvement. For example, they may have 30% no-show appointment, or 125% walk-in appointments—either way, these statistics indicate the doctor is losing control of the practice and needs to tighten scheduling and follow-up practices.
We recommend that doctors or office managers review the graphs once a month to keep a pulse on growth trends and to make accurate plans for the future.
Platinum System also has an Efficiency Control System that can email statistics automatically, including the number of new patients, conversion percentages, collections, total visits, and much more. Staff members don’t have to spend time writing the information down, and all information is delivered right to the doctor’s inbox.
Plus, if you ever have any questions about how to use the reporting and statistics tools, or any other EHR matter, our 5-star customer support team is always standing by at 888-880-8602.
Platinum System offers the fastest and most reliable billing and EHR software in the industry, and consistently earns five star reviews for customer service. To discuss how Platinum System might serve the unique EHR and billing needs of your practice, contact us online, or call us at 888-808-4898.