PLATINUM ANALYTICS · BUSINESS INTELLIGENCE

Data-driven decisions, real results.

Real-time dashboards and custom reports built from every data point your practice generates — see what’s working, fix what isn’t, and grow with confidence.

Live data from every module 50+ pre-built reports Drill down to the transaction Alerts before it costs you
Revenue +12% YoY Report exported
SEE IT IN ACTION

Your whole practice, at a glance.

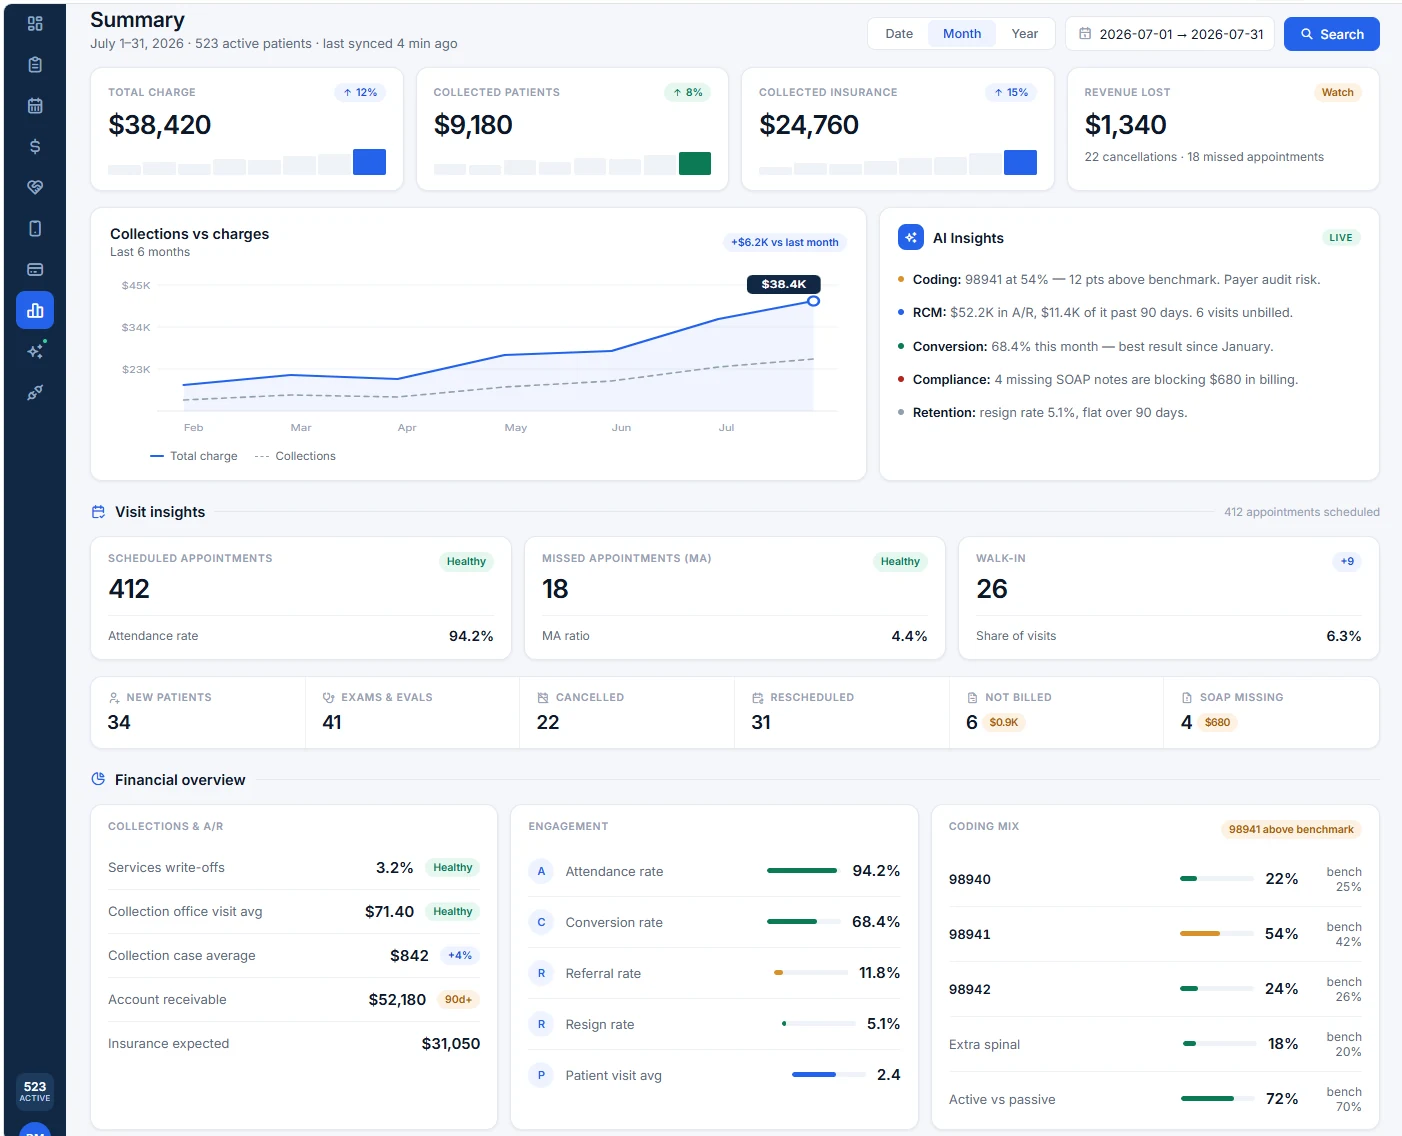
Every module feeds the same dashboards — EHR, PMS, RCM, CRM and Payments — so practice health lives on one screen, not in five spreadsheets.

  • Revenue, schedule & provider KPIs, live
  • Drill down from any number to the detail
  • Alerts flag problems before they grow
  • 50+ reports ready on day one
  • Forecasts you can staff against
Full size
The Platinum analytics dashboard — practice KPIs, revenue and visit charts and provider figures on one screen.
Real screen — the practice dashboard, fed live by EHR, scheduling and billing.
WHAT THE DASHBOARDS GIVE BACK

Practice health, measured.

Three numbers owners feel first: the growth the data unlocks, the reports ready on day one, and how much of the practice you can actually see.

12%
average revenue growth
50+
pre-built reports
100%
data visibility
EVERY NUMBER THAT RUNS THE PRACTICE

Know your practice by the numbers.

Platinum Analytics turns every interaction into intelligence you can act on — no spreadsheets, no guesswork.

WHERE OWNERS LOOK FIRST

Financial dashboards

Revenue trends, collection rates, outstanding balances, payer mix and cash flow — all visualized in real time with drill-down capability.

What it means: you know where the practice stands today, not six weeks after the month closes.

Operational KPIs

Schedule fill rate, no-show percentage, patient wait times and front-desk efficiency metrics — tracked automatically.

What it means: you spot a slipping schedule while there’s still time to fill it.

Provider performance

Compare provider productivity, revenue per visit, patient volume, documentation speed and patient satisfaction scores.

What it means: coaching conversations start from facts, and your best practices spread across the team.

Pre-built & custom reports

Start with dozens of ready-made reports, then create custom ones with drag-and-drop filters, date ranges and export options.

What it means: the answer takes a minute to pull — no analyst, no spreadsheet weekend.

Trend analysis

Identify patterns in patient volume, revenue cycles, seasonal trends and growth opportunities with historical comparisons.

What it means: you see the slow season coming and plan for it instead of reacting to it.

Forecasting

Predictive analytics forecast revenue, patient volume and resource needs based on historical data and current trends.

What it means: you hire, staff and invest against next quarter’s numbers, not last quarter’s.

AI & AUTOMATION, BUILT IN

From data to decisions.

Analytics that runs itself — the numbers come to you, with the “why” attached.

A patient back to an active life after care.
What every number on the dashboard is finally measuring: whether the care is working.

Automated alerts

KPIs drift, you know first — no-show spikes, aging A/R, fill-rate dips.

Predictive forecasting

Next month’s revenue and volume, projected from your history — plan staffing with confidence.

Drill-down detail

Every number opens into the visits, claims and payments behind it.

You stop going to look for the number. The number comes to you, on the week you can still do something about it.

Explore the AI layer
HOW IT WORKS

Three steps to data-driven decisions.

No setup marathon, no manual entry — the journey below runs on its own.

  1. Data flows in

    Every visit, claim and payment is captured as it happens and organises itself. There is no export, no import and no manual entry.

    Nothing to key in
  2. Dashboards come alive

    Revenue, KPIs and provider performance update live — and any number opens into the visits, claims and payments behind it.

    Total to transaction
  3. You decide

    Alerts surface a dip while there is still time to fix it, and forecasts back the staffing and spending calls you have to make next.

    Early, not after
BEFORE & AFTER

What changes on Monday.

Nothing about how you run the practice. Everything about how fast you can see it.

✕  Before Platinum
  • Practice health scattered across five spreadsheets
  • You learn where the month landed six weeks after it closes
  • A simple question costs a spreadsheet weekend
  • A slipping schedule is noticed after the slots are gone
  • The slow season arrives as a surprise
✓  With Platinum Analytics
  • Revenue, schedule and provider KPIs live on one screen
  • You know where the practice stands today
  • The answer takes a minute to pull
  • Alerts flag the dip while there’s still time to fill it
  • Forecasts show it coming, so you plan for it
ONE CONNECTED SYSTEM

Analytics connects to everything.

Every module feeds the same dashboards — one complete picture of practice health, never a partial view.

QUESTIONS OWNERS ASK

Before you open the dashboards.

Every module feeds the same dashboards — EHR, PMS, RCM, CRM and Payments — so practice health lives on one screen, not in five spreadsheets. There is no manual entry; the data organizes itself.

Dashboards update live — revenue, schedule and provider KPIs in real time, so you know where the practice stands today, not six weeks after the month closes.

No. Start with dozens of ready-made reports, then create custom ones with drag-and-drop filters, date ranges and export options — the answer takes a minute to pull.

Yes. Every number opens into the visits, claims and payments behind it — you can drill down from any total to the transaction.

Automated alerts flag drifting KPIs first — no-show spikes, aging A/R, fill-rate dips — so problems surface before they grow.

Yes. Predictive analytics forecast revenue, patient volume and resource needs from your historical data and current trends, so you hire, staff and invest against next quarter’s numbers.

INSIDE THE CLINIC

Real practices, real people.

Behind every number is a decision someone has to make. Clear dashboards mean owners spend less time digging for answers — and more time acting on them.

A front desk team member checking a patient in at the counter.
The dashboard is only useful if it reaches the people running the day — so it does.

“Platinum helped us defeat brain overload!”

Dr. Kim Meier
Meier Chiropractic · MT
SEE YOUR NUMBERS, LIVE

Stop waiting for the month to close.

See Platinum Analytics run against a real practice — revenue, schedule, providers and payers, live on one screen.

HIPAA compliant SOC 2 Type II Built for chiropractic